Division of Science, NAOJ
Cosmological constraints from HSC-Y1 cosmic shear using E/B mode COSEBIs
Authors: Takashi Hamana (NAOJ), Chiaki Hikage (Kavil IPMU), Masamune Oguri (Chiba University), Masato Shirasaki (NAOJ & The Institute of Statistical Mathematics), Surhud More (The Inter-University Center for Astronomy and Astrophysics)
Overview:
Cosmic shear is the coherent distortion of the shapes of distant galaxies caused by gravitational lensing of intervening large-scale structures, and is one of the most powerful tools for cosmology.
We perform a cosmic shear analysis of Hyper Supreme-Cam Subaru Strategic Program first-year data (HSC-Y1) to derive cosmological constraints. For an estimator of cosmic shear signals, we adopt orthogonal sets of E/B-integrals (COSEBIs) which allows us to separate the cosmic shear signals into independent E/B-modes.
We measure cosmic shear E/B-mode COSEBIs from shapes of ~10 million distant galaxies with good signal-to-noise ratios (Figure-1). We find that the B-mode signals are consistent with zero, which is consistent with the prediction of the standard gravity theory.
We perform a standard Bayesian likelihood analysis for cosmological inference from the measured E-mode COSEBIs, in which we adopt a covariance matrix derived from realistic mock catalogs constructed from full-sky gravitational lensing simulations done using the super-computer system XC30 at CfCA, NAOJ. We obtain constraints on cosmological parameters, the total matter density parameter and the amplitude parameter of the density fluctuation at present universe (Figure-2). It is found that our results are consistent with results of the CMB experiment by Planck mission, supporting the standard cold-dark matter universe model with the cosmological constant.
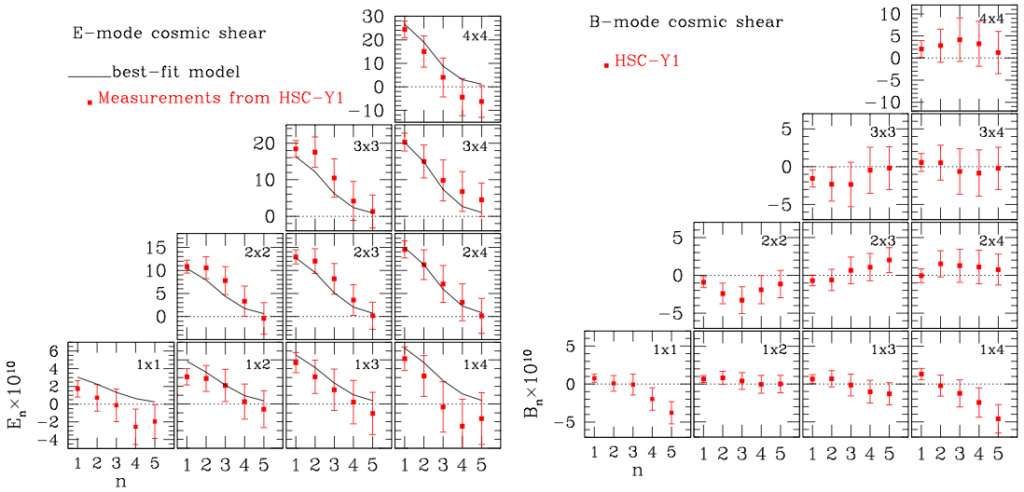
Figure-1: Comparison of the HSC-Y1 tomographic cosmic shear COSEBIs with the best-fitting theoretical model for the cold-dark matter model with the cosmological constant. Left and right triangular-tiled panels show E and B-mode cosmic shear COSEBIs, respectively. Error bars represent the square-root of the diagonal elements of the covariance matrix. The solid lines in the top panels correspond to the best-fitting (maximum likelihood) model.
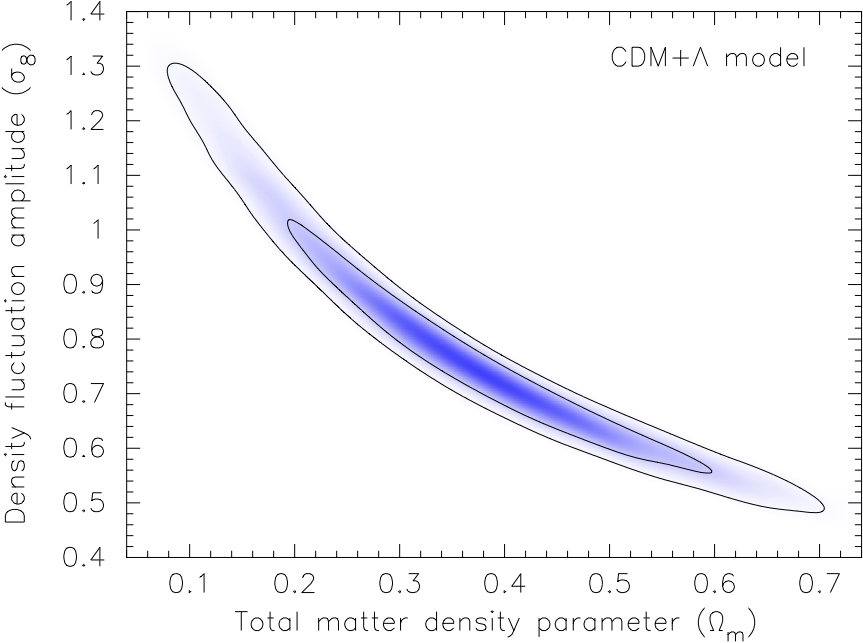
Figure-2: Marginalized posterior contours (68% and 95% confidence levels) with a blue scale for a visual overview of the distribution (darker for higher posterior) in the plane of the total matter density parameter (horizontal axis) and the amplitude parameter of the density fluctuation at present universe (vertical axis).
See the URLs below for the details.
Link to the paper (PASJ web page): https://academic.oup.com/pasj/article-abstract/74/4/923/6610012
Hyper Suprime-Cam Subaru Strategic Program: https://hsc.mtk.nao.ac.jp/ssp/
Center for Computational Astrophysics (CfCA): https://www.cfca.nao.ac.jp/